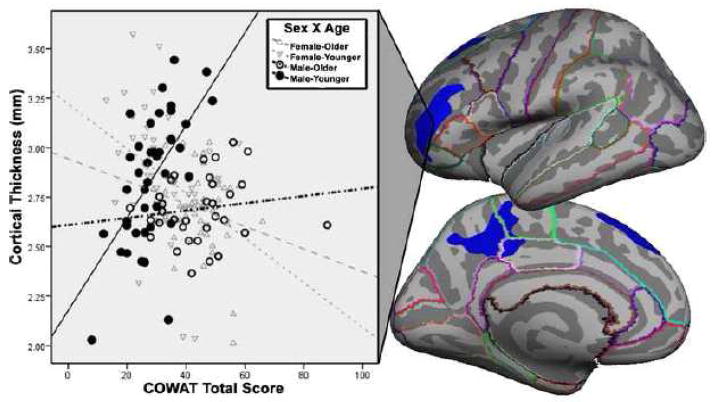
Figure 4. Sex differences in the COWAT–thickness relationship.
Left hemisphere brain images showing clusters covering areas in rostral middle frontal gyrus, superior frontal gyrus, medial paracentral gyrus, precuneus, and posterior cingulate where the direction and magnitude of the correlation between COWAT performance and grey matter thickness differs between males and females. The scatterplot shows the mean cortical thickness in this cluster plotted against COWAT total score. Females display the expected negative correlation in both age groups, whereas males show a positive correlation, markedly so for the younger males in the sample.

