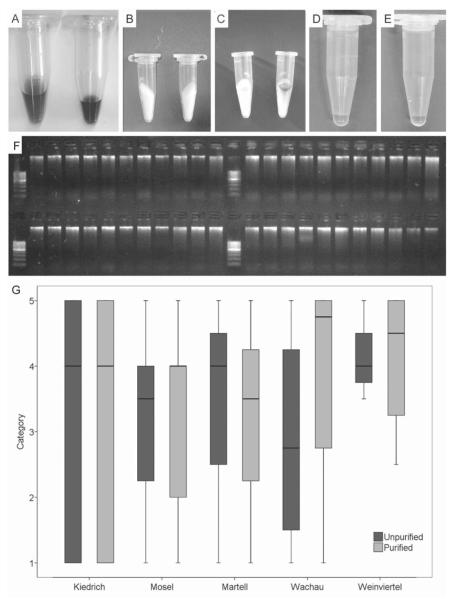
Fig. 3.
DNA extract purification. (A) Unpurified DNA raw extracts. (B) PVPP spin-columns. (C) Dark substances of DNA extracts bound to the spin column. (D, E) Purified DNA extracts. (F) DNA raw extracts (upper row) and purified DNA extracts (lower row) on 1.5% agarose gel. (G) Ratings of unpurified and purified DNA extracts of different soil samples (n= 12 for each soil). Data are expressed as a box-and-whisker plot showing median, inter-quartile range (IQR), and extreme values. Atypical outliers are indicated with an open dot (values 1.5–3×IQR), extreme outliners with an asterisk (values >3×IQR). A five-point-scale was used, whereby category one was assigned to bands with the highest intensity.

