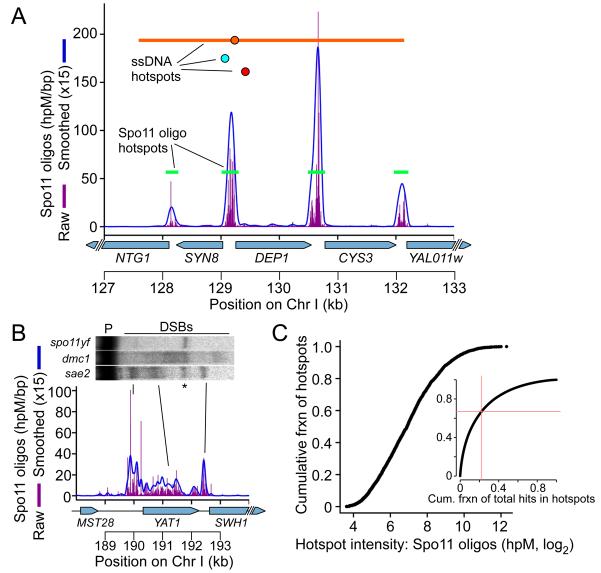
Figure 3. Identification and properties of DSB hotspots.
A. Hotspots near CYS3. Green bars are hotspots from this study. Hotspots from ssDNA mapping are also indicated (red and teal circles, peaks only (Buhler et al. 2007; Borde et al. 2009); orange circle and line, peak and region with signal over threshold (Blitzblau et al. 2007)).
B. Verification of an unusually broad hotspot by Southern blot of genomic DNA (labels as in Figure 1G). DSB signal in dmc1 spreads out because of hyperresection.
C. Hotspot intensities vary over a smooth continuum. Inset: cumulative fraction of hotspots vs. cumulative fraction of Spo11 oligos. Red lines mark the fraction of hotspot oligos in the weakest 67% of hotspots.

