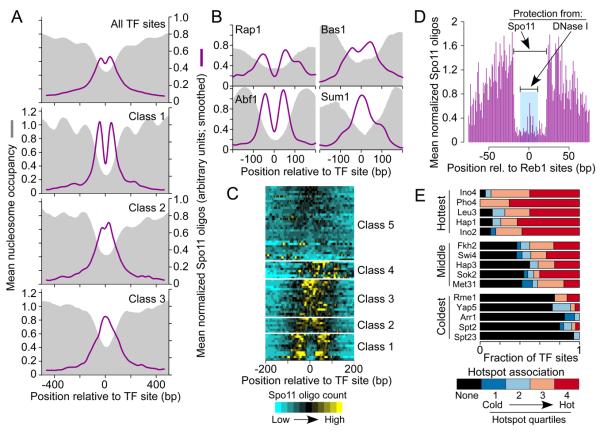
Figure 5. DSB patterns around TF binding sites.
A, B. Mean normalized Spo11 oligo profiles (see Supplemental Experimental Procedures), smoothed with 75 bp window, and nucleosome occupancy (3 hr sample) around TF sites.
C. TFs clustered according to local spatial pattern of Spo11 oligos. Each horizontal line on the heat map shows the mean profile for binding sites of a single TF, grouped by k-means clustering. Because locally normalized oligo counts were used, color coding reflects DSB spatial pattern, not total DSB intensity.
D. Zones of protection from Spo11 or DNase I (Hesselberth et al. 2009) around Reb1 binding sites (n=156).
E. TFs that are most or least associated with frequent DSB formation nearby. TFs were rank ordered by mean oligo count ±500 bp from their binding sites. A subset of TFs is shown, others are in Figure S6B. Bars depict the fraction of sites not in hotspots (black) and divide the remainder according to hotspot quartile.

