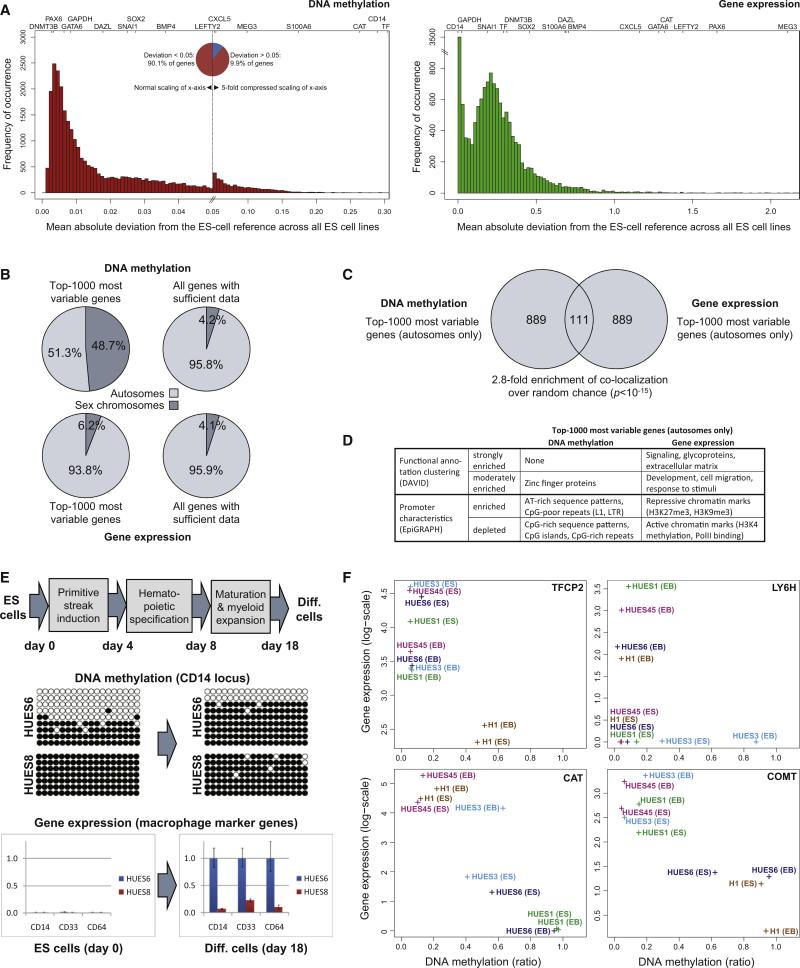
Figure 2. Epigenetic and Transcriptional Variation Targets Specific Genes and Influences Cellular Differentiation.
(A) Distribution of cell-line-specific variation in terms of DNA methylation and gene expression. The histogram shows the number of genes (y axis) that fall into each interval when calculating the mean absolute deviation of individual ES cell lines relative to the reference of all other ES cell lines (x axis). The position of selected genes within each histogram is highlighted on top. Note that the DNA methylation histogram (left) is extremely skewed; for better representation the x axis has been compressed 5-fold for the right half of the diagram, which gives rise to an artificial peak in the center of the histogram. The gene expression histogram (right) is characterized by a strong peak at zero, due to a large number of genes with zero expression and zero variation in all ES cell lines. Variation data for all genes are available from Table S3.
(B) Chromosomal distribution of the 1000 most variable genes in terms of DNA methylation (top left) and gene expression (bottom left). For comparison, the diagram also shows the chromosomal distribution of all genes with sufficient DNA methylation (top right) or gene expression data (bottom right).
(C) Comparison of the 1000 most variable genes in terms of DNA methylation (left) and gene expression (right). To prevent bias due to the chromosomal differences of male versus female cell lines, all X-linked and Y-linked genes were excluded. Significance of overlap was confirmed by Fisher's exact test.
(D) Functional and structural characteristics of the 1000 most variable genes in terms of DNA methylation (left) and gene expression (right). Functional annotation clustering was performed with the DAVID software (Huang et al., 2007), and the promoter characteristics were analyzed by the EpiGRAPH web service (Bock et al., 2009). This panel provides a summary of the results; the full results tables are available online http://scorecard.computational-epigenetics.org/.
(E) Epigenetic and transcriptional differences between two ES cell lines (HUES6 and HUES8) subjected to a defined hematopoietic differentiation protocol. DNA methylation levels were measured by clonal bisulfite sequencing at day 0 and day 18 of the differentiation protocol. White beads correspond to unmethylated CpGs, and black beads correspond to methylated CpGs. Rows correspond to individual clones, and columns correspond to specific CpGs in the promoter region of CD14. Similarly, gene expression of CD14 and two additional macrophage marker genes (CD33 and CD64) was measured by qPCR in two independent experiments (shown are three technical replicates) at day 0 and day 18 of the differentiation protocol. Error bars indicate ± one standard deviation.
(F) Cell-line-specific DNA methylation and gene expression levels at four genes with a known role in hematopoiesis (TFCP2, LY6H) and neural processes (COMT, CAT). Each data point denotes the combined DNA methylation (x axis) and gene expression (y axis) levels of an ES cell lines (“ES”) or the corresponding 16 day embryoid body (“EB”).

