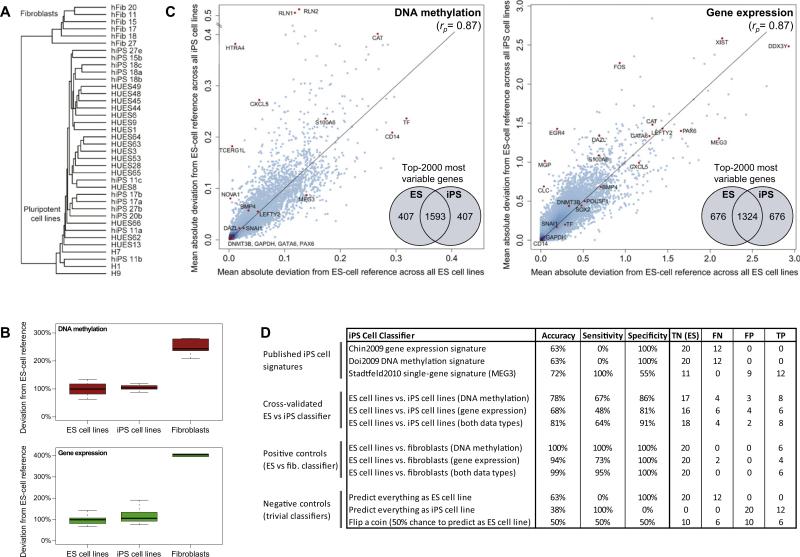
Figure 3. Cell-Line-Specific Deviation from the Reference Is Slightly Higher in iPS than in ES Cell Lines.
(A) Joint hierarchical clustering of 12 iPS cell lines (“hiPSx”), 20 ES cell lines (“HUESx,” “Hx”), and 6 primary fibroblast cell lines (“hFibx”). An extended version that includes heatmaps is available from Figure S2A. The numbers of the iPS cell lines connect them to the fibroblasts from which they were derived (e.g., hFib 18 was used to generate hiPS 18a, 18b, and 18c).
(B) Boxplots of the cell-line-specific deviation from the ES cell reference, averaged over all genes and scaled such that the mean deviation of the 20 ES cell lines is equal to 100%.
(C) Scatterplots comparing the gene-specific deviation of 20 ES cell lines (x axis) with the gene-specific deviation of 12 iPS cell lines (y axis), in both cases measured relative to the ES cell reference and averaged over all ES or iPS cell lines, respectively. To prevent comparing cell lines to themselves, each ES cell line was temporarily removed from the ES cell reference when it was compared to the reference. Selected genes are highlighted in orange, rp refers to Pearson's correlation coefficient, and the inset Venn diagrams visualize the overlap between the 2000 most deviating genes in ES versus iPS cell lines. The reprogramming factors OCT4, SOX2, and KLF4 were excluded from the DNA methylation analysis because transgene silencing gives rise to spurious hypermethylation among the iPS cell lines (Figure 4A and Figure S2C).
(D) Performance table summarizing the predictive power of three previously published iPS cell signatures and three newly derived classifiers for distinguishing between ES and iPS cell lines. For comparison, the table also lists the performance of three newly derived classifiers for distinguishing between ES cell lines and fibroblasts (positive controls) and the performance of three trivial classifiers (negative controls). Shown are the prediction accuracy, sensitivity, and specificity for identifying iPS cell lines (true positives, TP) among ES cell lines (true negatives, TN), while minimizing the number of cell lines that are incorrectly predicted as iPS cell lines (false positives, FP) or incorrectly predicted as ES cell lines (false negatives, FN). To increase the robustness of the results, all values were averaged over 100 randomized repetitions of the cross-validation. Minor numerical inconsistencies in the table are due to rounding all values to whole numbers.

