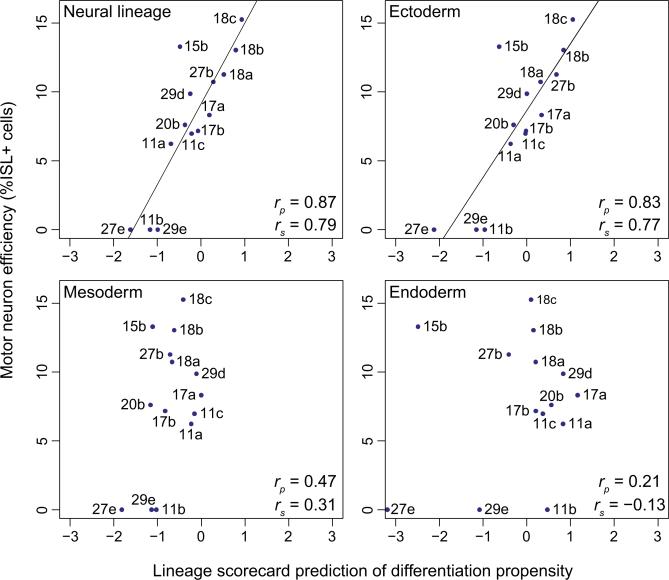
Figure 6. The Lineage Scorecard Predicts Cell-Line-Specific Differences in the Efficiency of Motor Neuron Differentiation.
Correlation between the lineage scorecard estimates for the neural lineage and three germ layers versus the cell-line-specific efficiency of directed differentiation into motor neurons (rp, Pearson's correlation coefficient; rs, Spearman's correlation coefficient). Motor neuron efficiencies were measured by the percentage of ISL1-positive cells at the end point of a 32 day neural differentiation protocol. Further details including biological replicates and standard errors are available from Table S7.

