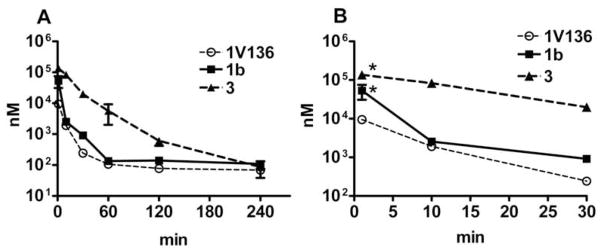
Figure 4.
In vivo PK study of various PEGylated compounds. C57BL/6 mice (n=3) were injected i.v. with 500 nmol PEGylated TLR7 ligands, and blood samples were collected at 1, 10, 30, 60, 120, and 240 min after administration. Drug concentrations (nM) were determined using an internal standard. The data shown are pooled from three independent experiments. The data plotted shows 0 to 240 min (A) and 0 to 30 min (B). AUC of 1V136, 1b and 3 are 97246 ± 10431, 355900 ± 231915, and 2483531 ± 222049, respectively. Data shown are pooled from two independent experiment. * denotes p<0.05 compared to 1V136 by one-way ANOVA with Dunnett’s post hoc testing.

