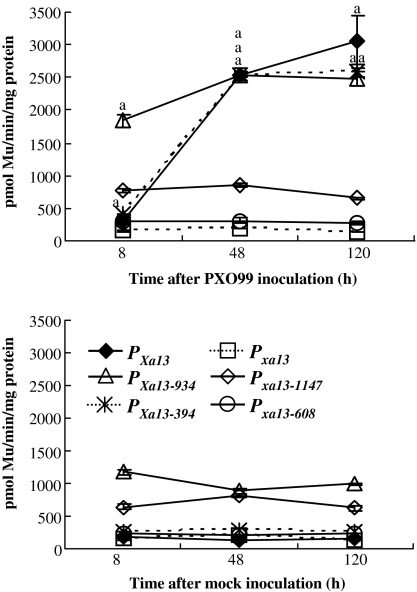
Figure 2.
The Expression of GUS Driven by Native (PXa13 and Pxa13) or Truncated (PXa13-934, PXa13-394, Pxa13-1147, and Pxa13-608) Promoters after PXO99-Inoculation or Mock-Inoculation at the Booting Stage.
GUS activity was determined by measuring the amount of 4-methylumbelliferone (Mu) produced under the catalysis of GUS in 1 mg total protein per minute. Sixteen to 22 T0 transgenic plants carrying each construct were used for analyses. For each time point examined, leaf fragments were collected from all the plants carrying the same construct and mixed to prepare a sample. The GUS activity at each time point was the average of three measurements ± standard deviation. The ‘a’ indicates that a significant difference (P < 0.01) was detected between pathogen-inoculated and mock-inoculated plants in the same time point.

