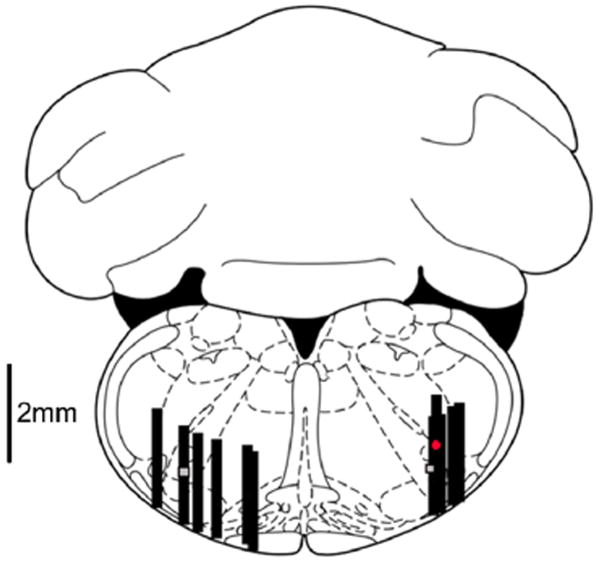
Figure 5. Microdialysis probe locations.
Dialysis probe tip locations (n=10) were marked using microinjection of KMnO4 at the midpoint of the 2mm × 0.4mm dialysis membrane. The level of the brainstem slice depicted in the drawing is 3.3 mm caudal to intra-aural. The grey squares represent the region of the preBötC. Black rectangles represent the 2mm dialysis membrane. The red circle represents an injection site 2mm cephalad to the preBötC. Animals with inadequate KMnO4 injection resulting in an insufficient lesion on the histological specimen were not included. The figure is adapted from a digital rat brain atlas (Paxinos & Watson, 2008).

