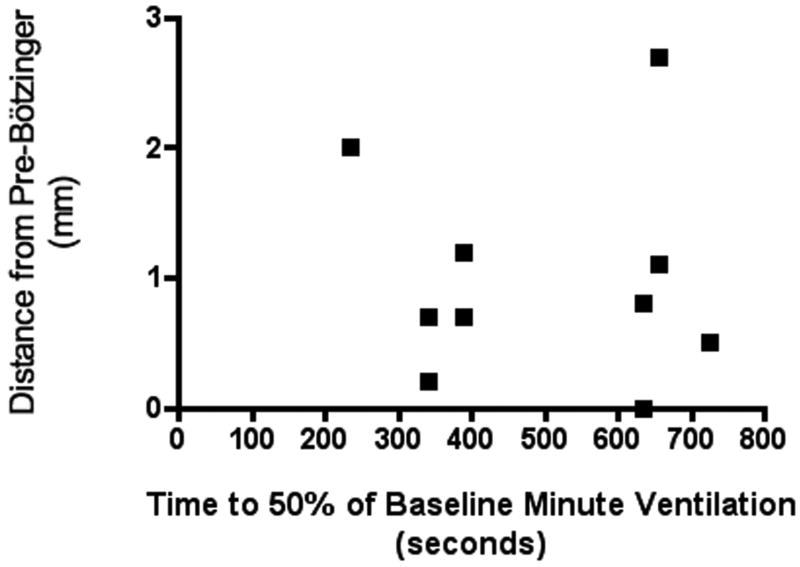
Figure 6. Relationship of changes in minute ventilation and average distance from preBötC.
The distance of the probe location from the preBötC was measured in three dimensions and plotted against time to 50% of baseline minute ventilation. Each dot represents an average of both sites for a single animal. Animals with inadequate KMnO4 injection resulting in an insufficient lesion on the histological specimen were not included.

