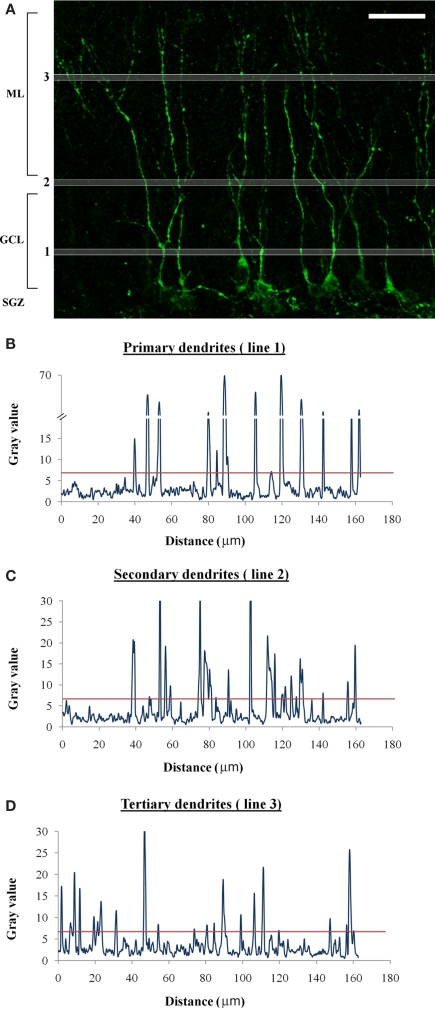
Figure 2.
Example of dendritic quantification. (A) High-resolution confocal stack image of a section through the DG immunostained for DCX. DCX-positive cell bodies are arranged along or just above the SGZ, primary dendrites are quantified along line 1 in the middle of the GCL, secondary dendrites are quantified along line 2 on the outer edge of the GCL and tertiary dendrites are quantified along line 3 in the ML. Scale bar = 20 μm. (B–D) plot profiles for lines 1–3 obtained using ImageJ software. The red line indicates the threshold (set for 7) and all the peaks that cross it are counted.

