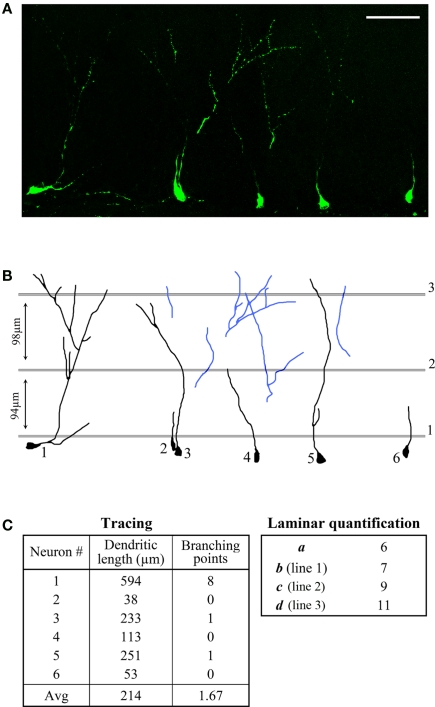
Figure 4.
Comparison between dendritic tracing and laminar quantification methods. (A) High-resolution confocal (collapsed stack) image of a section through the DG, showing neurons expressing GFP 14 days post-injection. Scale bar = 60 μm. (B) Tracings of six GFP-positive dendrites and measurement lines for the quantification of primary (1), secondary (2), and tertiary (3) dendrites. The blue dendrites were considered “disjointed” and were only included in the laminar quantification. (C) Values obtained using both methods.

