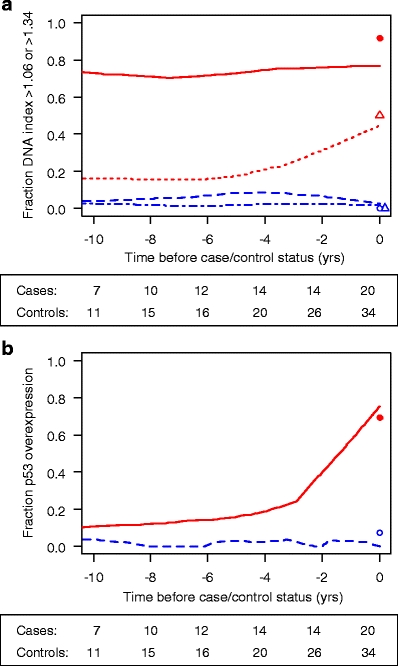
Fig. 3.

Fraction of biopsy specimens with abnormal DNA content/p53 immunopositivity over time prior to the development of colorectal cancer (CRC). a Fraction of abnormal DNA content. = cases, DI ≥1.06;
  = cases, DI >1.34;
  = controls, DI ≥1.06 and
  = controls, DI >1.34. b Fraction of p53 overexpression.
  = cases;
  = controls. The numbers under each figure represent the number of IBD patients at that time point. The symbols at time point zero represent the fraction of patients at either time point with progression (cases n = 20) or at last follow-up visit without progression (controls n = 34)
