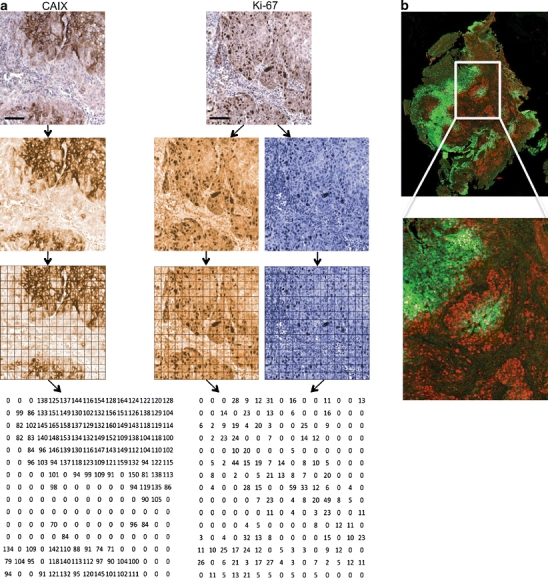
Fig. 1.

a Overview of the process of image preparation and analysis. Example of an original DAB and hematoxylin stained tumor section for Ki-67 and CAIX (top) with the resulting pseudo-colored grayscale images after linear unmixing (second row). The third and fourth row show the conversion of immunopositive objects into numerical data by parametric mapping using square compartments of 20 x 20 pixels. Note the intensity values in the resulting CAIX image map and the labeling indexes in the Ki-67 image map. b A pseudo-colored image was constructed by merging the Ki-67 (red) and CAIX (green) images to check the match with a magnification of the area indicated by the white square. Scalebars: 100 μm
