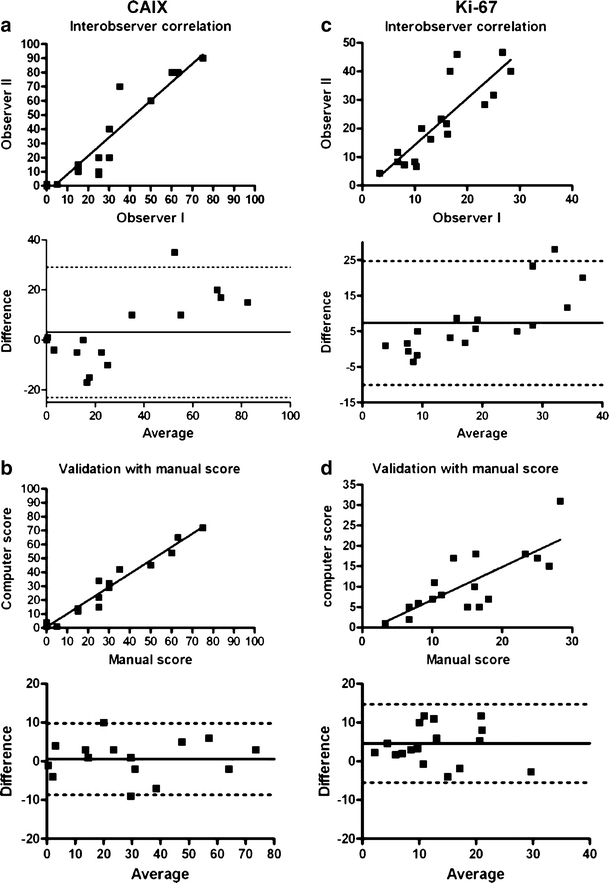
Fig. 3.

Correlation of automated analysis with manual scoring. A strong relationship between CAIX score of two observers (r s = 0.96, p < 0.0001) (a) and between automated measurement and manual score (r s = 0.97, p < 0.0001) (b) was observed, with a small bias of−0.6 as determined with the Bland-Altman analysis. For Ki-67, the interobserver correlation was less strong (r s = 0.90, p = 0.0001) (c) and the correlation with the automated analysis showed a bias of 4.2, with higher manual scores (d). Dashed horizontal lines represent the mean difference and the mean difference plus and minus 1.96 times the SD of the differences
