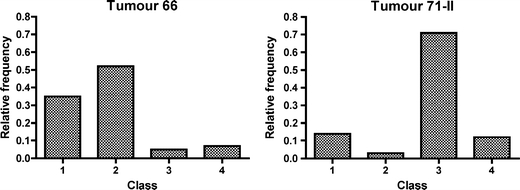
Fig. 6.

Example of two tumors with a different degree of colocalization. The squares of a whole tissue section were subdivided into four classes: class 1 contains squares with CAIX intensity < 100 and Ki-67 labelling index < 25, class 2 CAIX < 100 and Ki-67 ≥ 25, class 3 CAIX ≥ 100 and Ki-67 < 25, class 4 CAIX ≥ 100 and Ki-67 ≥ 25. The relative frequency distribution of tumor 66 (a) shows more class 2 square compartments, tumor 71-II (b) more class 3, representing a different degree of colocalization
