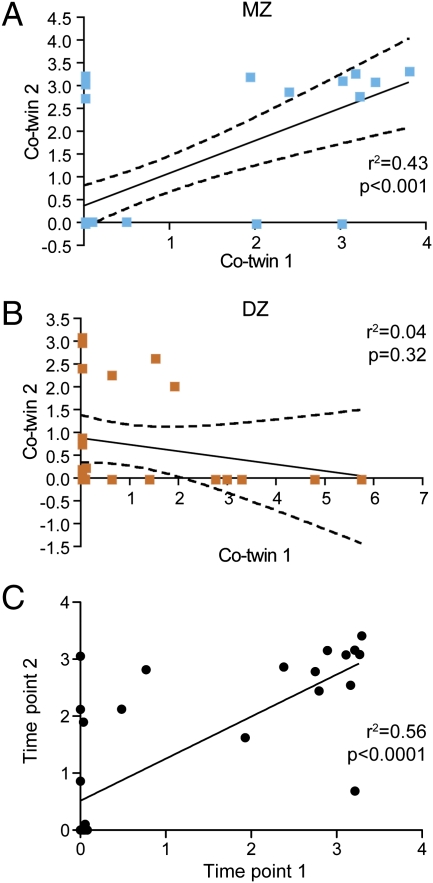
Fig. 1.
Correlation of methanogen levels in the fecal microbiota of MZ and DZ co-twins. The presence and levels of fecal methanogens were defined by qPCR assay that targeted the mcrA gene in samples obtained from MZ twin pairs (A) (n = 40) and DZ twin pairs (B) (n = 28). Dashed lines represent 95% confidence intervals for linear regression. (C) Correlation between mcrA levels in fecal samples collected at two time points per individual (2-mo interval between sampling). All axes in A–C are log10 (genome equivalents per ng total DNA +1).

