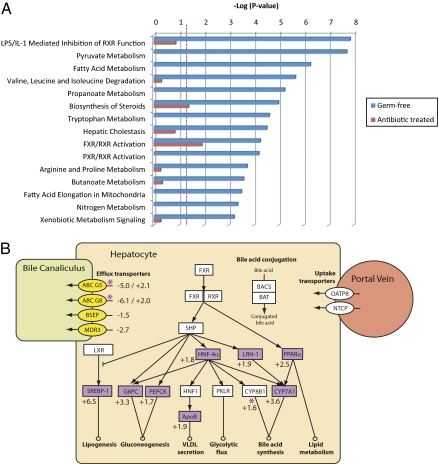
Fig. 4.
Hepatic metabolic and signaling pathways modulated by the gut microbiota. (A) Significantly regulated canonical gene expression pathways in GF rats (blue bars) and pathways common to AB rats (red bars). Scale is a log-transformed P value calculated by Fisher's exact test that a pathway is over-represented within the altered genes. Dotted red lines indicate threshold value (P < 0.05) for pathway change to be considered statistically significant. (B) Relationship between FXR/RXR-regulated genes and bile acid metabolic pathways. Purple shapes indicate up-regulated genes, and yellow shapes indicate down-regulated genes in GF rats with respect to conventional rats. Purple stars denote up-regulated genes in AB rats with respect to control rats. White shapes indicate genes that were present on the microarray but were unchanged in GF rats. Values indicate fold change in gene transcription in GF rats with respect to conventional rats and in AB rats with respect to control rats. ApoB, apolipoprotein B; G6PC, glucose-6-phosphatase; HNF, hepatocyte nuclear factor; LRH-1, liver receptor homolog-1; LXR, liver X receptor; PEPCK, phosphoenolpyruvate carboxykinase; PKLR, pyruvate kinase; PPARα, peroxisome proliferator-activated receptor α; RXR, retinoid X receptor; SHP, short heterodimer partner; SREBP-1, sterol regulatory element binding protein-1.

