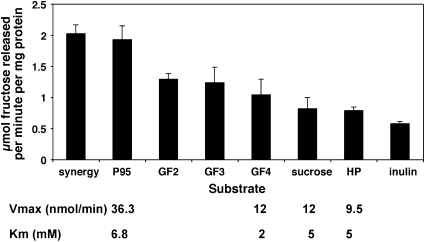
Fig. 3.
Activity of the cloned enzyme with specific substrates (at 10 mM) after 2-h incubation. The stated amount of fructose (μmol) released per milligram of protein per minute is the average of four independent experimental values. The specific enzyme activities (Vmax and Km), calculated from four independent experiments, are shown for four substrates.

