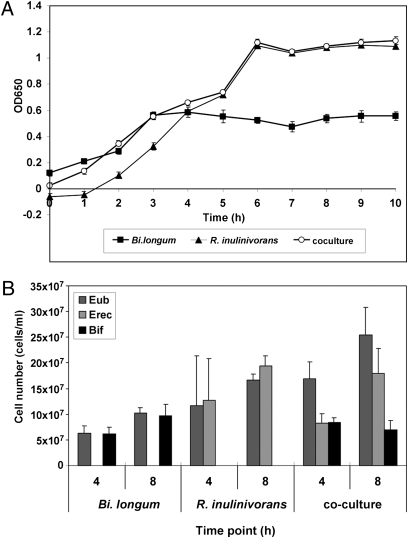
Fig. 5.
Data from the coculture experiment after growth of R. inulinivorans A2-194 and Bi. longum 20219 on Synergy1. (A) Growth curve showing the increasing OD650 at hourly intervals of Bi. longum (■), R. inulinivorans (▲), and coculture (○). (B) Number of bacterial cells at 4-h and 8-h time points enumerated by FISH using the eubacterial probe (Eub338) and probes to specifically detect R. inulinivorans (Erec482) and Bi. longum (Bif164).

