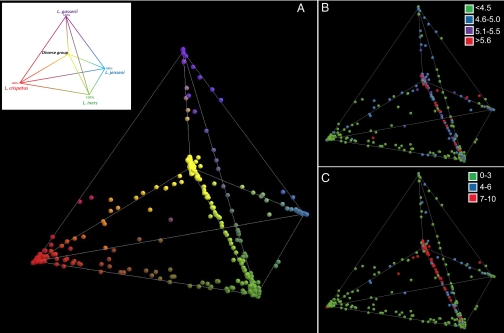
Fig. 4.
Relationships among vaginal bacterial communities visualized by principal component analysis in which the relative abundances are expressed as proportions of the total community and displayed in 3D space. Communities dominated by species of Lactobacillus and representing community groups I, II, III, and V are shown at each of the four outer vertices of the tetrahedron, with communities of group IV at the inner vertex and shown in the Inset. (A) Each point corresponds to a single subject and was colored according to the proportions of phylotypes in each community. (B) pH of each vaginal community shown in A. (C) Nugent score category of each vaginal community shown in A.

