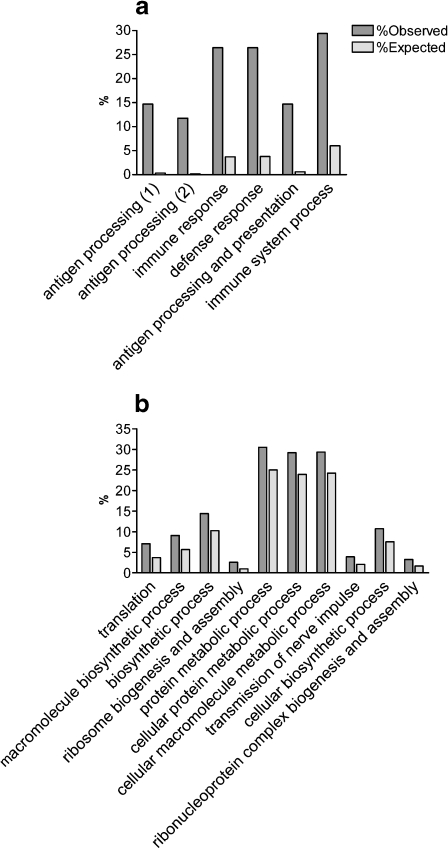
Fig. 3.
GO annotation analysis detected significantly enriched biological process among the age-dependent differentially expressed genes. The most significant (P < 0.001) biological processes among the 47 Bonferroni-corrected (a) and 1,543 FDR-corrected (b) differentially expressed genes are presented here. Full descriptions of all significantly overrepresented annotations in all GO categories (biological process, molecular function, and cellular component) are listed in Supplementary Table 2a and b. Dark gray bars represent the observed percentages of genes among the age-dependent differentially expressed genes. Light gray bars depict the expected percentages of genes as represented on the entire array. The annotations on the X-axis are in ascending order of P values. In a, the annotations antigen processing (1) and (2) stand for “antigen processing and presentation of peptide antigen” and “antigen processing and presentation of peptide antigen via MHC class I,” respectively

