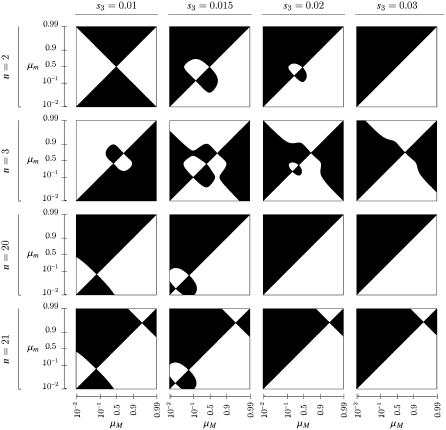
Figure 5.—
Pairwise invasibility plots for mutation rate modifier. Combinations of resident mutation rate μM and invading mutation rate μm in the open regions yield a leading eigenvalue >1 in absolute magnitude; the leading eigenvalue is <1 in the solid regions. We assume that w1 = 1 − s1 and w3 = 1 − s3 and set s1 = 0.01. Each row denotes a different value for n, the number of generations in each environment. The recombination rate is set to r = 0. Note that the x- and y-axes are logarithmically scaled from 10−2 to 0.5 and from 1 − 10−2 to 1 − 0.5.

