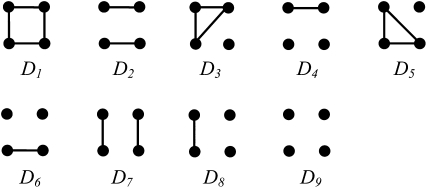
Figure 1.—
Identity-by-descent modes of the four genes at a locus of two diploid individuals. Each group of four dots represents an IBD mode, with the top pair of dots representing the two genes in individual X and the bottom pair of dots representing the two genes in individual Y. Genes connected by lines are IBD.

