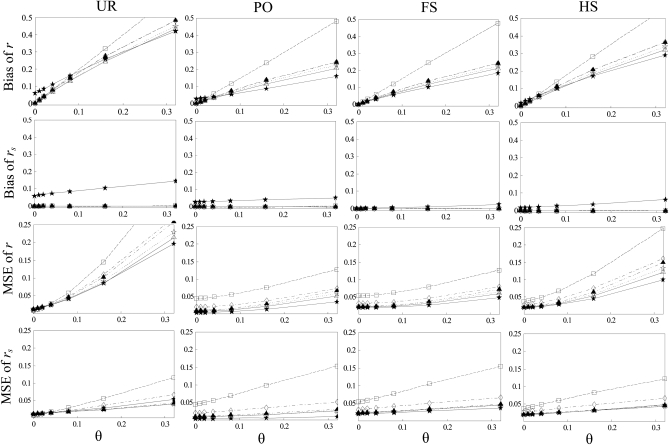
Figure 2.—
Bias and MSE of relatedness estimates for unrelated (UR), parent–offspring (PO), full-sib (FS), and half-sib (HS) individuals drawn from a subpopulation, as a function of the differentiation (θ) of the subpopulation from the ancestral population. Relatedness was estimated assuming either a large random mating population (θ = 0, rows 1 and 3) or a structured population with known θ-value (rows 2 and 4). In both cases, the allele frequencies in the entire population are assumed known and used in the estimation. Ten markers, each having 10 alleles with frequencies in a uniform Dirichlet distribution, are used for estimating relatedness. The symbols in the plot are listed in Table 2, which are as follows: ▵,  and
and  ; ⋆,
; ⋆,  and
and  ; ⋄,
; ⋄,  and
and  ; □,
; □,  and
and  ; ▴,
; ▴,  and
and  ; and ★,
  and
and  .
.

