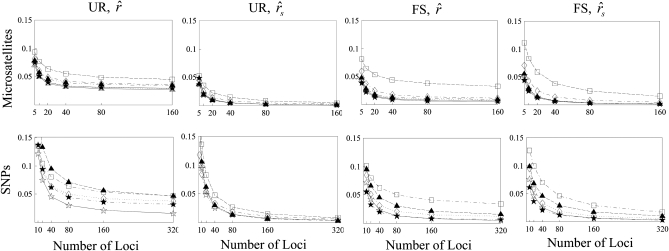
Figure 3.—
MSE of relatedness estimates for unrelated (UR) and full-sib (FS) individuals drawn from a subpopulation, as a function of the number of markers used in the estimation. The subpopulations are differentiated with a parameter value of θ = 0.1. Relatedness was estimated assuming either a large random mating population (θ = 0, columns 1 and 3) or a structured population with known θ-value (columns 2 and 4). In both cases, the allele frequencies in the entire population are assumed known and used in the estimation. For microsatellites and SNPs, each marker has 10 and 2 alleles, respectively, whose frequencies in the entire population are drawn from a uniform Dirichlet distribution. The plotting symbols for the different estimators are listed in Table 2. For SNPs, the estimator of Wang (2002) and that of Lynch (1988) and Li et al. (1993) are identical and thus only the latter is shown.

