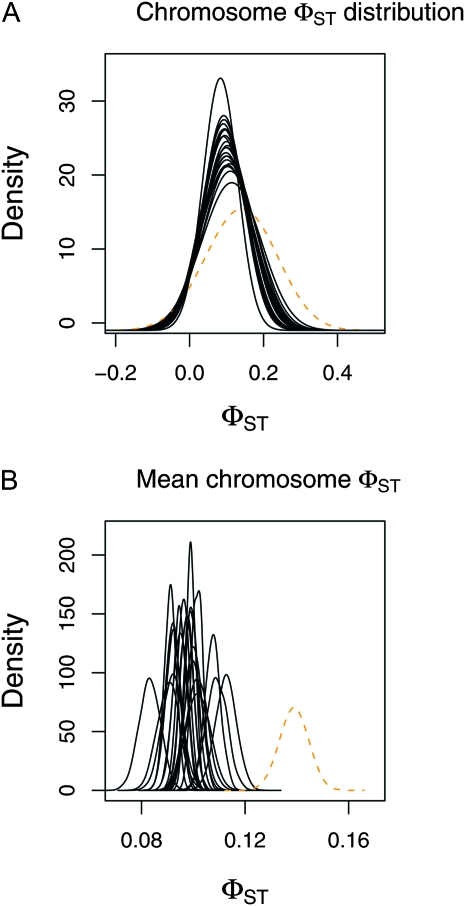
Figure 3.—
Chromosome-level estimates of φST for the large sample of human genetic diversity in 33 populations (data from Jakobsson et al. 2008). (A and B) Point estimates of each chromosome-level φST distribution (based on the median from the posterior probability distributions of αST and βST) are denoted with solid black lines (autosomes) or a dashed orange line (A; X chromosome). (B) Posterior probability distributions for the mean chromosome-level φST for each chromosome.

