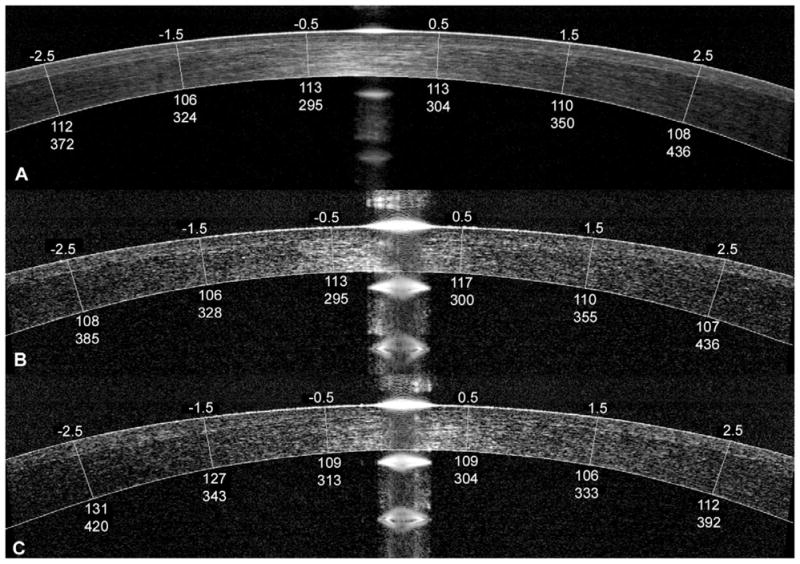
Figure 1.

Corneal Fourier-domain OCT images overlapped with flap thicknesses measured with a manual flap computer caliper tool. A: Frame-averaged horizontal line scan. B: Horizontal single frame cross-sectional image from a pachymetry scan. C: Vertical single frame cross-sectional image from the pachymetry scan. For each image, the upper numbers represent distances from the central cornea (mm). The lower numbers represent flap thickness and RSB (μm), respectively.
