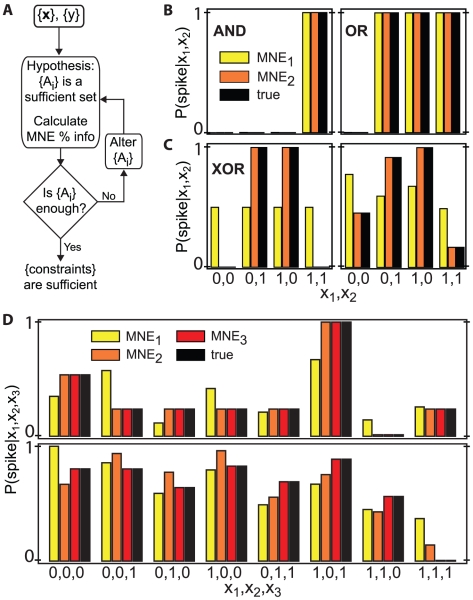
Figure 2. Using the MNE method for response functions to binary inputs.
A) Flowchart representing how to determine the relevant constraints. The hypothesis that a minimal set of constraints is sufficient is tested by constructing the corresponding MNE model and calculating the information captured by the model. If the percent information is insufficient, the set of constraints is augmented. B) Response functions and MNE models for two binary inputs; the true system is shown in black, and first and second order MNE models ( and
and  ) in yellow and orange, respectively. The AND and OR gates use only first order interactions; both MNE models explain
  of the information. C) The XOR gate (left) uses only second order interactions;
  explains 0% while
  explains 100% of the information. An example of a mixed response function (right), for which both first and second order interactions are used (10% and 100% respectively). D) Two examples of response functions with three binary inputs, with
  shown in red. Only second order interactions are necessary for the top gate, with 48%, 100% and 100% of the information captured by the first, second and third order MNE models. For the bottom gate, the models capture 39%, 71% and 100% of the information, indicating that third order constraints are necessary. In all cases,
  was calculated assuming a uniform input distribution.

