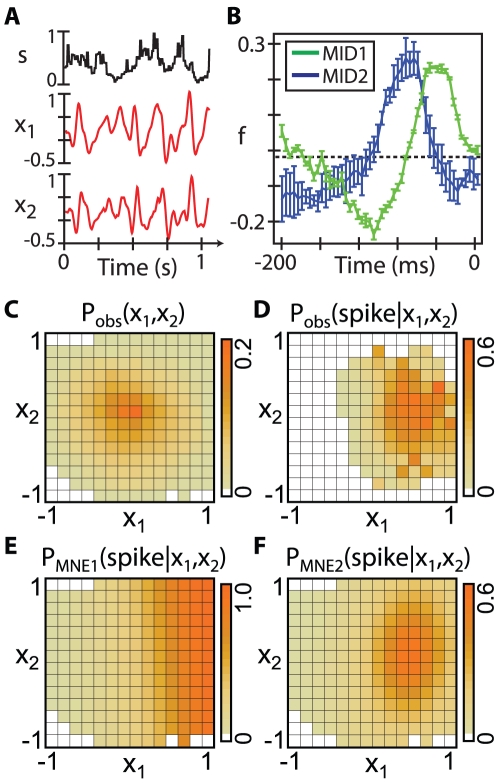
Figure 3. MNE models for a RGC.
A) The normalized luminance  of the visual input, along with the two most informative reduced inputs,
  and
and  , shown for a section of the stimulus presented to neuron mn122R4_3_RGC. B) The two maximally informative dimensions (MID) for this neuron (error bars are standard error in the mean). Each dimension is a filter which spans 200 ms before the neural output. The convolution of these filters with the stimulus produce
  and
and  , which are normalized to lie in the range -1 to 1. In this 2-
 reduced input space, the input distribution, C), and observed response function, D), are shown, discretized into 14 bins along each dimension. White squares in the input distribution indicate unsampled inputs, while white squares in the response function indicate no spikes were recorded. The first order, E), and second order, F), MNE response functions for this cell explain
  and
and  of the information, respectively.

