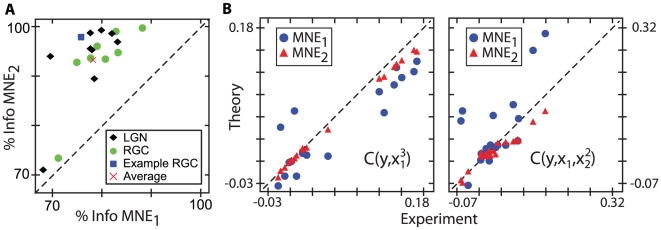
Figure 4. Second order MNE models are sufficient across the population.
A) A direct comparison of the percent information captured by  and
and  . No cells are sufficiently modeled with a first order model, but most are with the second order model. The average information captured is
  for
for  and
and  for
for  . B) Comparison of experimentally measured values to theoretical predictions for higher-order unconstrained moments. Predictions for
  , left, and
  , right, show a dramatic improvement when second order interactions are included in the model.

