Fig. 1.
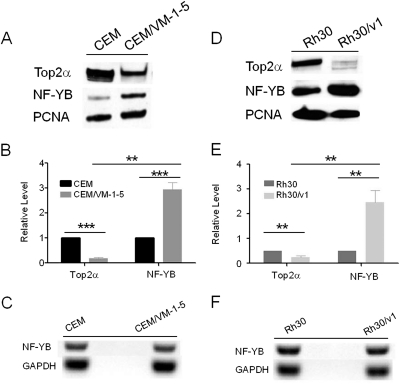
Inverse relationship between the protein levels of Top2α and NF-YB in CEM and CEM/VM-1-5 cells and Rh30 and Rh30/v1 cells. Western blots of nuclear Top2α and NF-YB expression in CEM and CEM/VM-1-5 cells (A) and Rh30 and Rh30/v1 cells (D). PCNA served as loading control for nuclear proteins. Average of Top2α and NF-YB levels from three independent experiments ± S.D. are shown, determined by densitometric scanning on Western blots and normalized to PCNA signal; either CEM (B) or Rh30 (E) was assigned a value of 1 for comparison. **, p < 0.005; ***, p < 0.0001. C and F, NF-YB mRNA expression was analyzed by semiquantitative RT-PCR in CEM and CEM/VM-1-5 cells (C) and Rh30 and Rh30/v1 cells (F).

