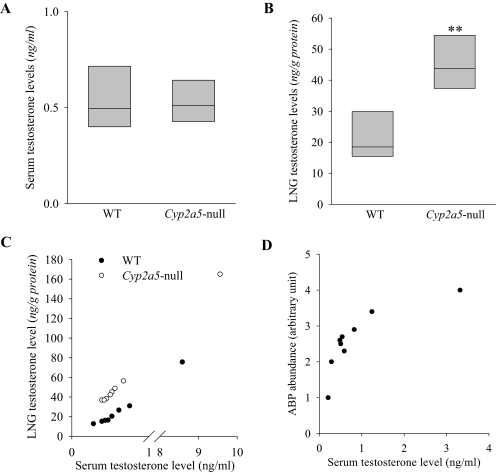
Fig. 5.
Testosterone levels in the serum and LNG of WT and Cyp2a5-null male mice. Serum (A) and LNG (B) testosterone levels were determined for 2- to 3-month-old male B6 WT and Cyp2a5-null mouse. The values shown are the medians, together with the 25% (lower bar) and 75% (upper bar) percentile marks. Testosterone levels in the LNG (but not the levels in the serum) were significantly higher in the Cyp2a5-null than in the WT mice (n = 8); **, P < 0.01, Mann-Whitney rank sum test. C, correlation of LNG testosterone levels with serum testosterone levels. LNG and serum testosterone levels for each mouse were plotted. The correlation coefficient (r) for LNG versus serum is 1.000 (P < 0.01) in WT, and 0.976 in Cyp2a5-null (P < 0.01) mice; Spearman rank order correlation test. D, correlation of LNG ABP protein levels with serum testosterone levels. LNG cytosol ABP levels determined by immunoblot analysis and serum testosterone levels were determined for nine male B6 mouse (2- to 3-month old). The correlation coefficient (r) for LNG ABP versus serum is 0.883 (P < 0.05); Spearman rank-order correlation test.

