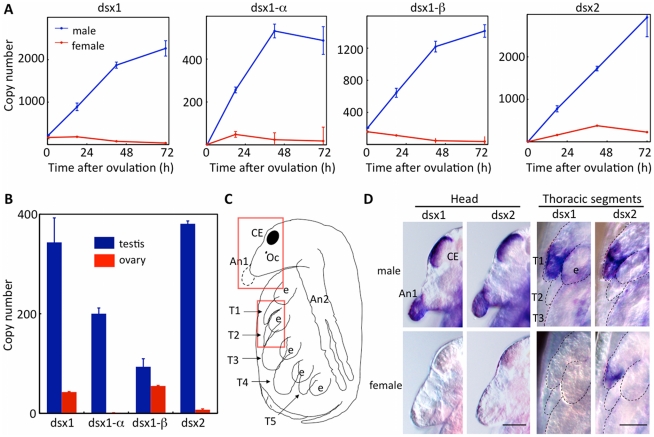
Figure 2. Temporal and spatial dimorphic gene expression of Dsx genes during development.
(A) Male and female embryos were obtained and gene expression levels of Dsx1 and Dsx2 were determined at 18 h, 42 h and 72 h after ovulation by quantitative RT-PCR using primers corresponding to Dsx1 and Dsx2 coding sequence (CDS). Dsx1-α and DSX1-β transcripts were also quantified using primers specific to each 5'UTR. Copy numbers were estimated by quantification compared with an external standard and dividing by the number of embryos used. Bars indicate S.E.M. (B) Expression of dsx genes in adult gonads was quantified. PCR primers corresponding to Dsx1 CDS, two types of 5'UTRs of Dsx1 gene and Dsx2 CDS were used for quantitative PCR. Bars indicate S.E.M. (C) Schematic illustration of D. magna late embryo. The red boxes indicate the areas shown in panel D. (D) Whole mount in situ hybridization in late embryos using DIG-labeled probes corresponding to Dsx1 and Dsx2. The heads and the thoracic segments are magnified. Bars indicate 50 µm (heads) and 100 µm (thoracic segments). CE: Compound eye, Oc: Ocellus, An1: First antennae, An2: Second antennae, e: Epipod, T1-5: First to fifth thoracic segments.

