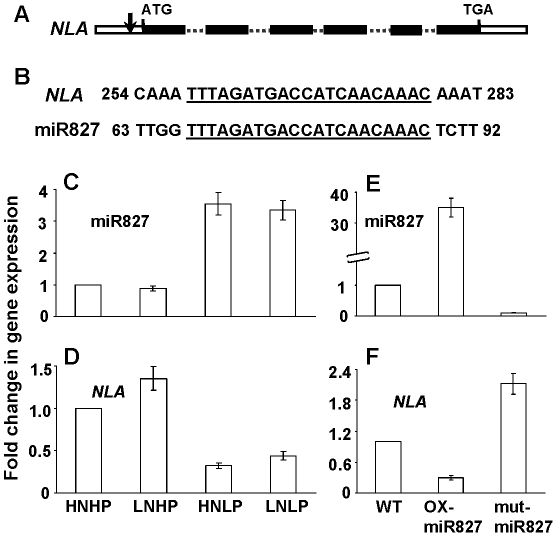
Figure 2. Regulation of NLA expression by miR827.
(A) NLA gene organization, exons (black boxes), introns (dotted lines), and UTR (empty boxes). Arrow indicates putative target site of miR827. (B) Partial sequences of NLA and miR827, the complementary sequences are underlined. (C) Relative expression of miR827, and (D) NLA in WT plants grown at HNHP (10 mM NO3−-10 mM Pi), LNHP (3 mM NO3−-10 mM Pi), HNLP (10 mM NO3−-0.5 mM Pi), and LNLP (3 mM NO3−-0.5 mM Pi). (E) Relative expression of miR827, and (F) NLA in WT, miR827-overexpressor, and miR827-mutant plants grown at 10 mM NO3−-10 mM Pi conditions. Expression levels were determined by real-time PCR. Shown are mean ± SD.

