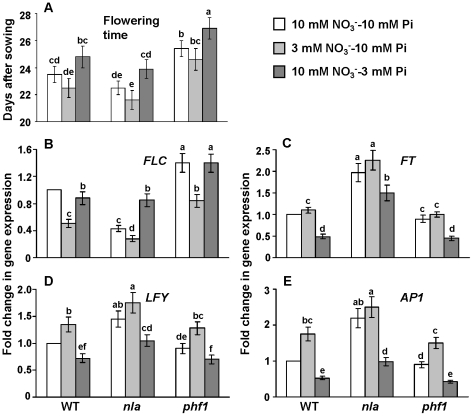
Figure 4. Effect of nitrate and phosphate regimes on flowering in Arabidopsis.
(A) Flowering time (days after sowing), (B, C, D, and E) The relative expression of FLC, FT, LFY, and AP1 genes, respectively, in leaves of WT, nla and phf1 plants. Total RNA was extracted from leaves of plants harvested at 18 days after sowing. Relative transcript levels were determined by real-time PCR. Shown are mean ± SD. Bars with different letters indicate significant difference at P<0.05.

