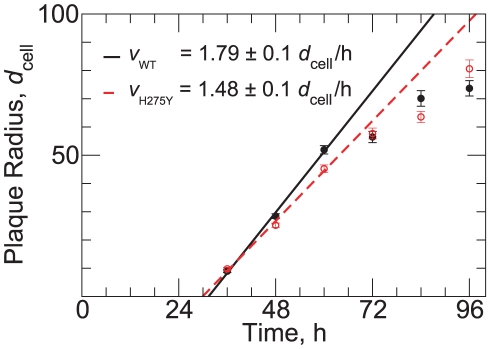
Figure 2. Growth of plaque radius in time and the determination of plaque velocity.
Plaque radius as a function of time for the WT (filled circles) and H275Y mutant (open circles) A/Brisbane/59/2007 (H1N1) pair. Points indicate the average plaque radius over all plaques at a given time with SEM errorbars. Linear fits to the first three time points are shown for the WT (solid line) and H275Y (dashed line). The unit of length used here,  , is the average diameter of an ST6GalI-MDCK cell (see Materials and Methods).

