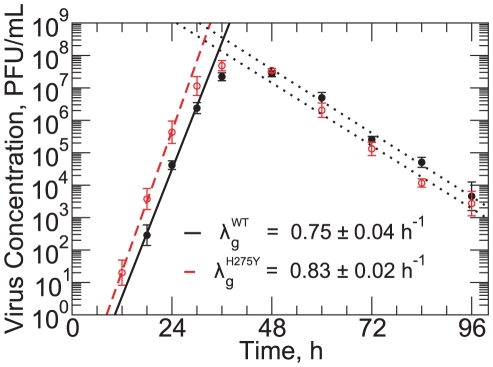
Figure 3. Multiple-cycle viral yield experiment.
Viral yield in time for the A/Brisbane/59/2007 (H1N1) WT (filled circles) and H275Y mutant (open circle) strains. Linear fits on the log-linear graph determine the rates of exponential growth,  , for the WT (solid line) and H275Y mutant (dashed) strains, as well as the rates of viral titer decay (dotted). The decay rate, which is assumed to be the rate of viral infectivity loss,
  , was found to be
  for both strains.

