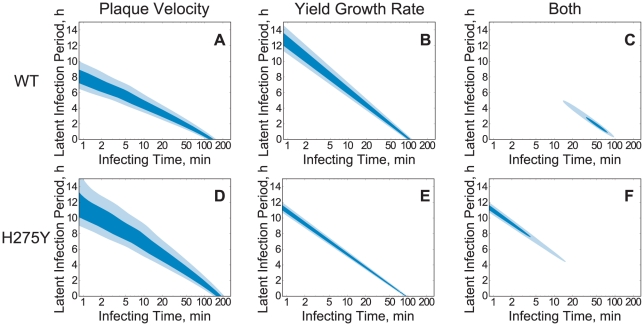
Figure 6. Determination of viral kinetics parameters.
Parameter region where the parameter values are most consistent with the experimentally-measured values of the plaque velocity (A and D), the exponential viral titer growth rate (B and E), and with both measures (C and F), for the A/Brisbane/59/2007 (H1N1) WT (first row) and H275Y mutant (second row) strains. Darker shading represents parameters more consistent with the experimental measures and two contour lines in each plot indicate the one and two standard deviation values (see Materials and Methods for details of this calculation).

