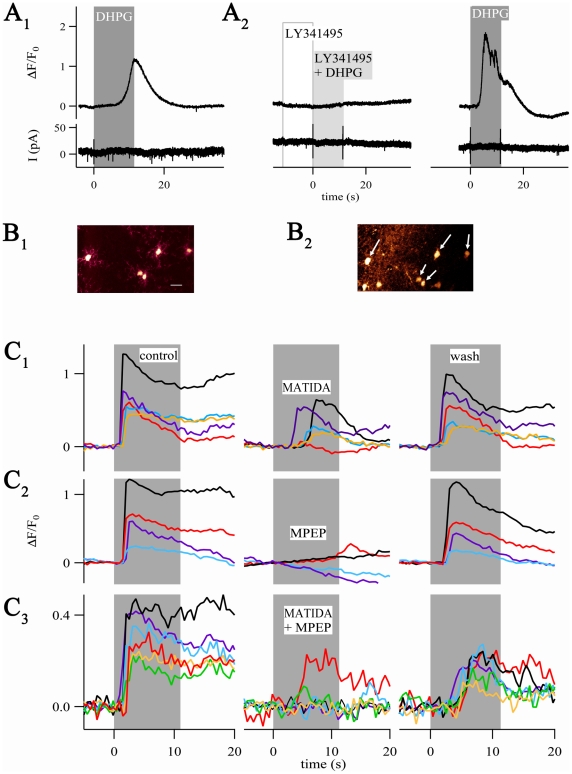
Figure 7. NG2 cells express mGluRs.
(A1) The group I mGluR agonist 3,5-DHPG (100 µM, 11 s) produced [Ca2+]i increases (upper trace) but not membrane currents (bottom). (A2) Pre-application of LY341495 (10 µM, 11 s) followed by co-application of 3,5-DHPG (10 µM, 11 s) completely blocked the 3,5-DHPG-induced [Ca2+]i elevation. Three min later, 3,5-DHPG (10 µM, 11 s) again provoked a [Ca2+]i elevation in the same cell. (B1) Region of interest with five NG2/EYFP cells (bar, 20 µm) which was selected for focal application of Fluo-4 AM (B2). Arrows mark NG2 cells from which [Ca2+]i elevations were recorded (also seen in C1). Note Fluo-4 labeled, EYFP-negative cells located in the lower left corner. (C1–C3) [Ca2+]i elevations upon 3,5-DHPG in the presence (middle) and absence (left, control; right, wash) of subtype-specific mGluR antagonists. Antagonists were pre-applied for 23 s, followed by 11 s co-application with 3,5-DHPG (10 µM, gray boxes). Applications were separated by 3 min. (C1) The mGluR1 specific antagonist 3-MATIDA (50 µM) mostly exerted partial block of Ca2+-responses. (C2) In most cells, 3,5-DHPG-mediated [Ca2+]i elevations were abolished by the mGluR5 specific antagonist, MPEP (20 µM). (C3) In a few cells, co-application of both antagonists failed to inhibit 3,5-DHPG-induced [Ca2+]i elevations. Experiments shown in (C1–C3) were performed in the presence of the blocking cocktail described in the text. Each row represents one individual brain slice.

