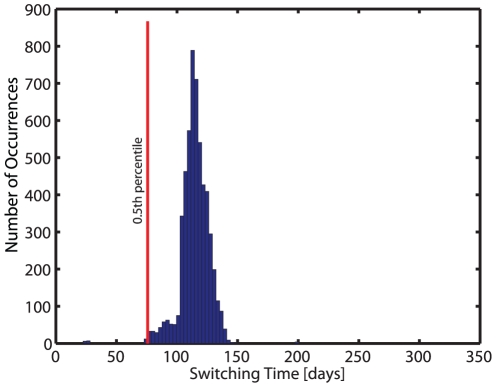
Figure 3. Histogram of optimal, individual treatment switching times.
Switching times for changing from inducer- to maintenance therapy were automatically determined and carried out (using eq. (1)). The 0.5th percentile, marked by the red line, was determined and the corresponding time  days was used as a fixed value in the suggested strategy to switch from inducer- to maintenance therapy. Hybrid deterministic-stochastic simulations were performed at clinically relevant parameter sets (see Table S1). Drug switches occurred in a total of 5478 out of 6000 simulations.

