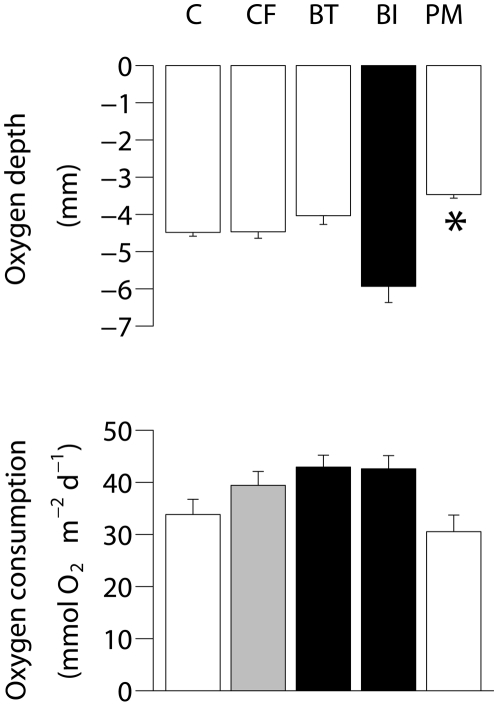
Figure 3. Maximum oxygen depth at the end of the experiment (upper) and averaged oxygen consumption of measurement on day 3 and 10 (lower) in control (C), control + food (CF), bioturbator (BT), bio-irrigator (BI) and physical mixing (PM) treatments.
Results of pairwise tests are indicated by the colour of the bars (cf. Figure 1). Significantly lowest values are marked with “*”. Error bars indicate SE.

