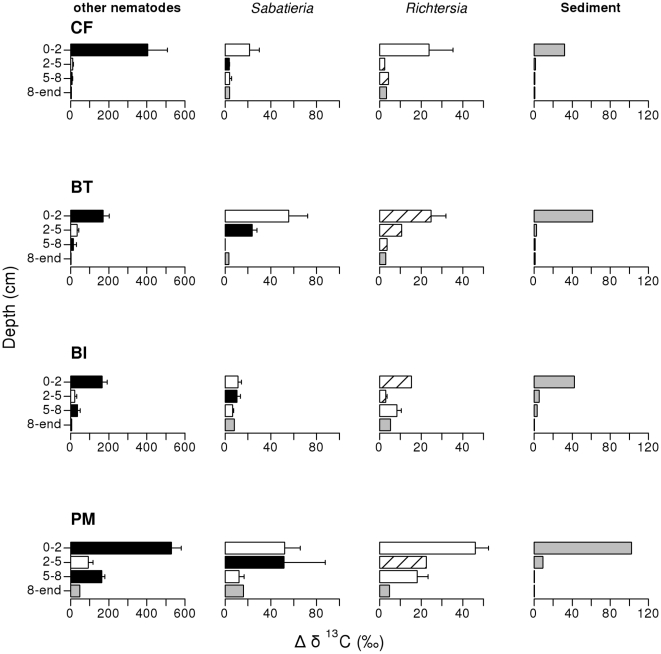
Figure 5. Specific uptake (Δδ13C) of labelled diatoms by ‘other nematodes’, Sabatieria and Richtersia and averaged TOC in the different depth layers in the control + food (CF), bioturbator (BT), bio-irrigator (BI) and physical mixing (PM) treatments.
Specific uptake differed among TR (PM> BI and BT) and among DxSp. For nematodes, the results of the pairwise tests of Sp within DxSp interaction are indicated by the colour of the bars (cf. Figure 1). Coarse striped bars indicate <3 replicates. Note different scaling of x-axes. Error bars indicate SE.

