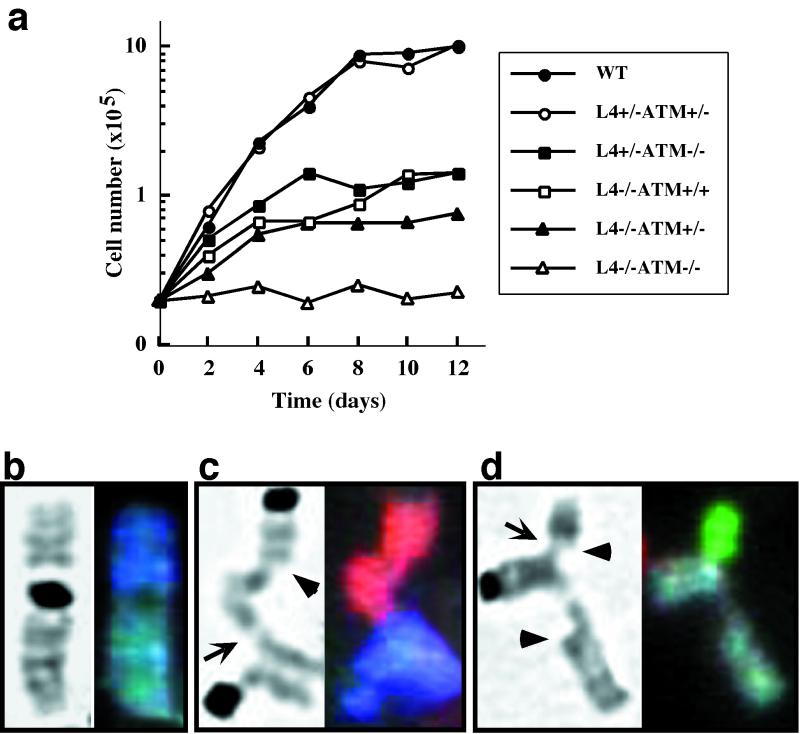
Figure 2.
Growth analysis and cytogenetic studies of MEFs. (a) Growth curves of Lig4−/−ATM−/− MEFs with controls. Genotypes are as indicated in the graph. (b–d) Metaphase chromosomes from primary MEF cultures. Arrows indicate single chromatid fusions; arrowheads indicate single chromatid breaks. (b) Robertsonian translocation (chromosome fusion) in an ATM−/− metaphase involving chromosomes 4 (dark blue) and 1 (gray). (c and d) Partial translocations in Lig4−/−ATM−/− metaphases. (c) Chromosome 2 (red) contains a broken chromatid in which one end remains free and the other is fused to a chromatid on chromosome 13 (bright blue). (d) Chromosome 1 (gray) contains a broken chromatid with two free ends, whereas the other chromatid is fused to a single chromatid of chromosome 8 (green).

