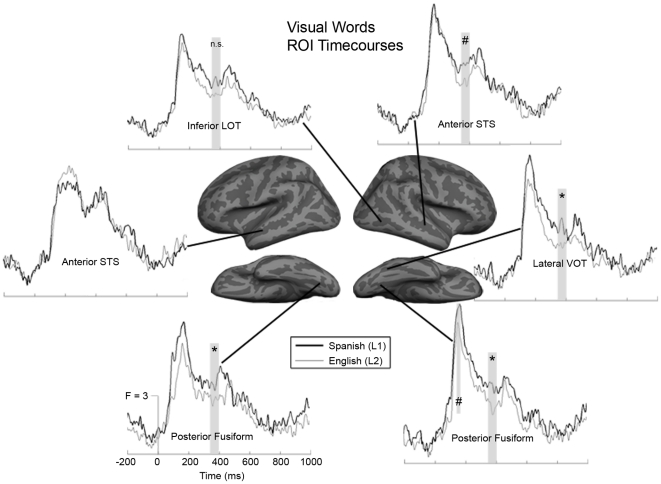
Figure 3. Average time courses for selected ROIs to new visual words.
Several regions show significant (denoted by *) or marginal (denoted by #) Spanish (thick lines) > English (thin lines) effects during the early (150–190 ms) and late (350–400 ms) time windows (gray bars). Responses appear generally greater over an extended time period for Spanish than for English, especially in right hemisphere and posterior areas.

