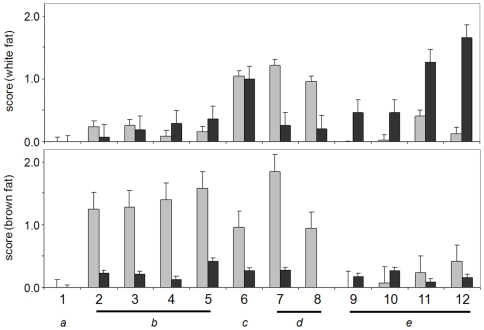
Figure 4. Comparison of substrate metabolism in brown and white preadipocytes and adipocytes.
Normalized optical-density scores representing nutrient metabolism, showing the greatest differences between white fat (top) and brown fat (bottom) cells in either an undifferentiated (gray bars) or differentiated (black bars) state. Included are a) wells that cause no change (1, negative control), b) nutrients that are high in brown preadipocytes and decrease upon differentiation (2, α-D-glucose-1-phosphate; 3, D-glucose-6-phosphate; 4, D-fructose-6-phosphate; 5, glycogen), c) a similarly behaved nutrient that is high in white fat (6, hexanoic acid), d) nutrients that decrease during differentiation of both cell types (7, dextrin; 8, butyric acid), and e) nutrients that increase upon white fat differentiation (9, L-leucine; 10, Leu-Leu; 11, succinamic acid, 12. acetoacetic acid). The normalized scores shown are reprentative of two independent biological experiments. The error bars represent the error for the six alpha-D-glucose wells in each experiment, which was taken as the largest and most conservative estimate of the error for other nutrients.

