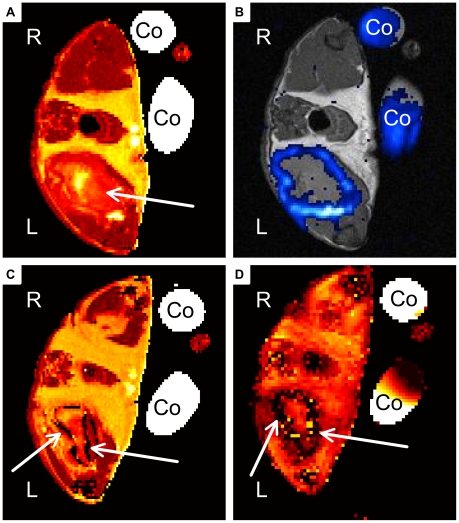
Figure 2. Representative MR Images of chronic soft-tissue infection.
A, B) Mouse received PFC at day 8 post infection. Images were recorded 24 h after administration. C, D) Mouse received CLIO at day 8 post infection and was imaged 24 h after administration. A) Transverse T2 map of PFC group mouse shows large hyper-intensity area within infected muscle (arrow). B) 19F-SSFP CSI overlay on 1H-TSE image of PFC group mouse shows strong accumulation of PFC at the rim of abscess area. C) Transverse T2 map of CLIO group mouse shows hyper-intense area circumscribed by a dark rim (arrows). D) T2* weighted image shows strong susceptibility effects around the infected muscle in a hollow sphere pattern (arrows (Co: Control tube filled with PFC dilution, R: right side, L: left side of the imaged mouse).

