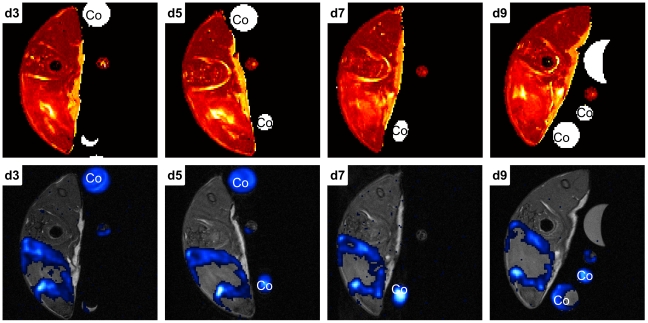
Figure 5. Representative MR-slice series showing the time course of PFC accumulation following administration at acute phase.
Mouse received PFC at day 2 p.i. and was imaged every 48 h beginning at d3 p.i.. The upper row of images shows T2 weighted MR-slices, the lower row the corresponding 19F-SSFP CSI overlays on 1H-TSE images. 19F signal could be visualized in all measurements until d9 p.i. (end point).

