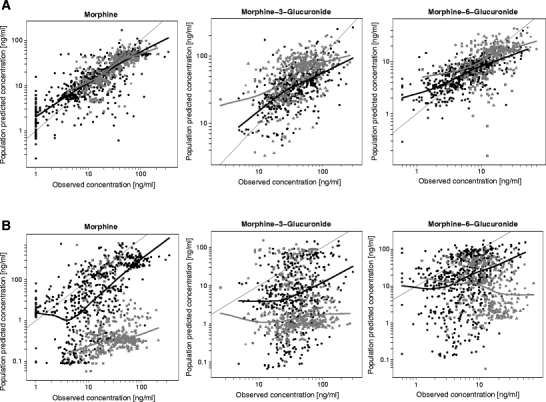
Fig. 3.

Population predicted concentrations versus observed concentrations including loess curves of morphine and its metabolites for the systematic covariate model (A) and fixed allometric model (B). Data points in black originate from the internal dataset and data points in grey from the external datasets. Different symbols are used for different external datasets: ■ = Ext. 1(9), ● = Ext 2(10), ♦ = Ext 3(11),* Ext 4(7), ▲ = Ext 5(8).
